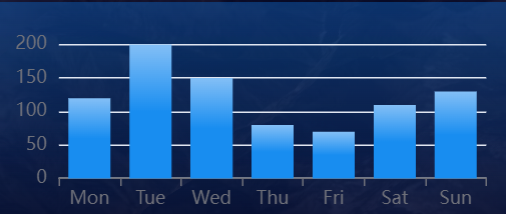
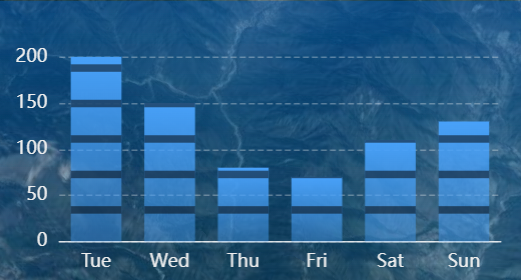
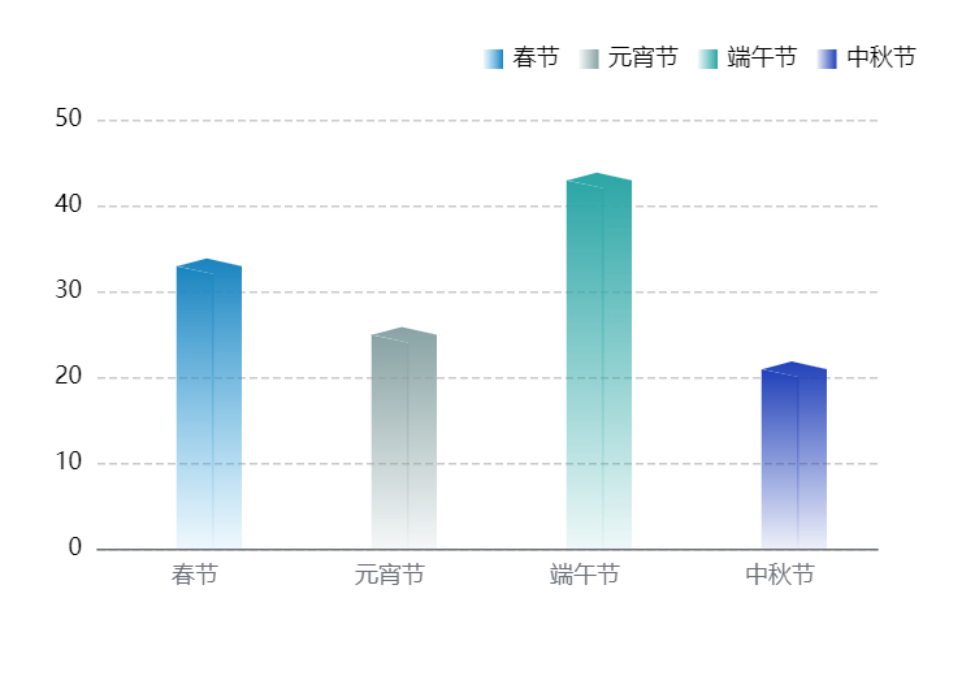
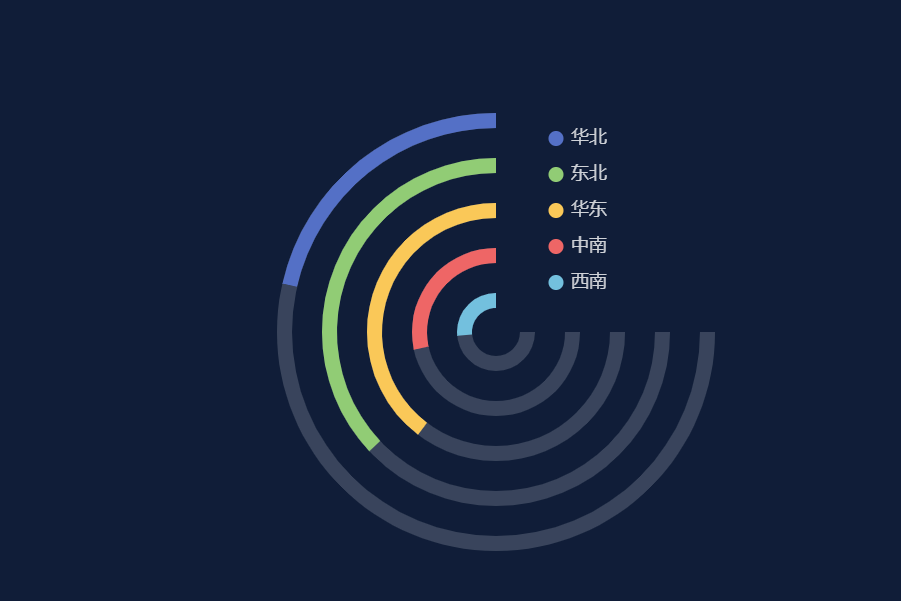
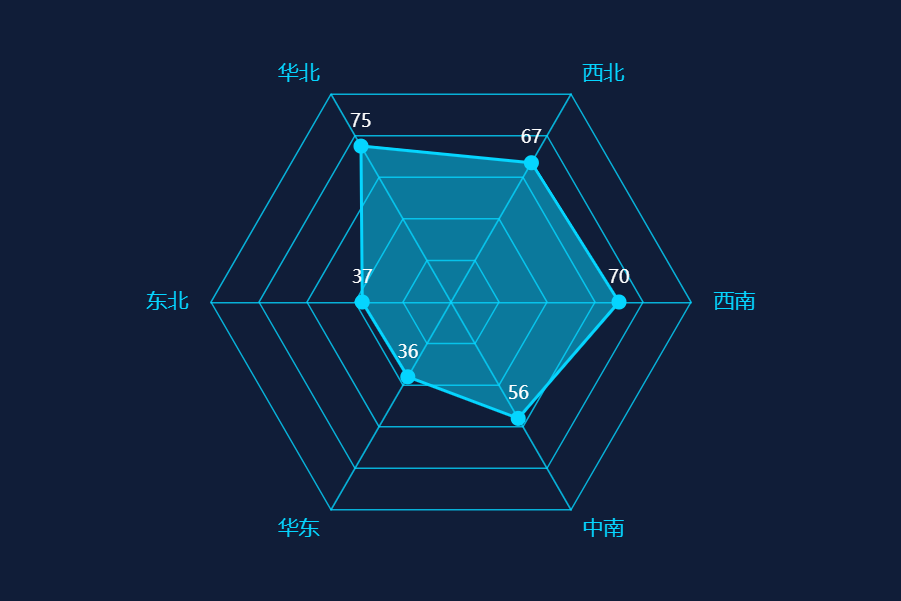
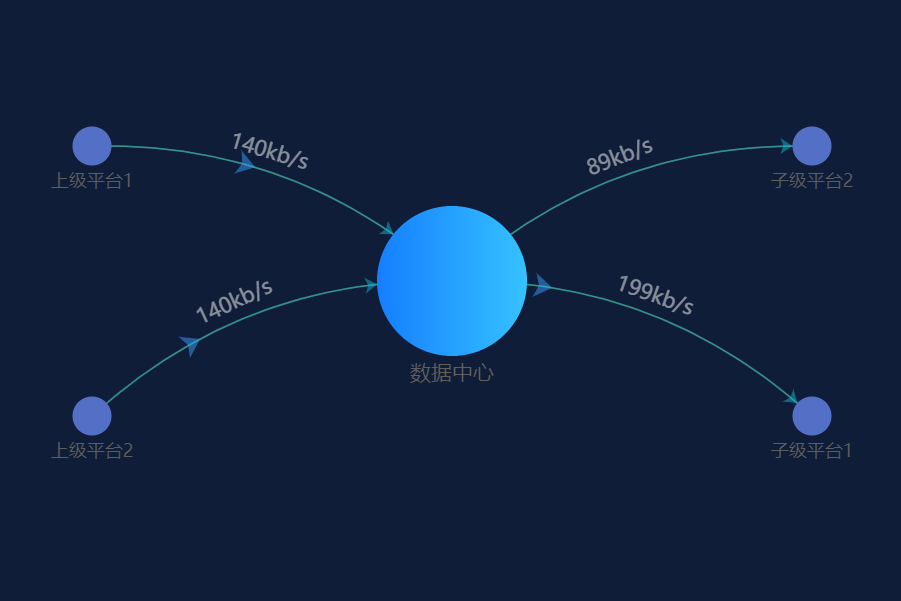
柱状图

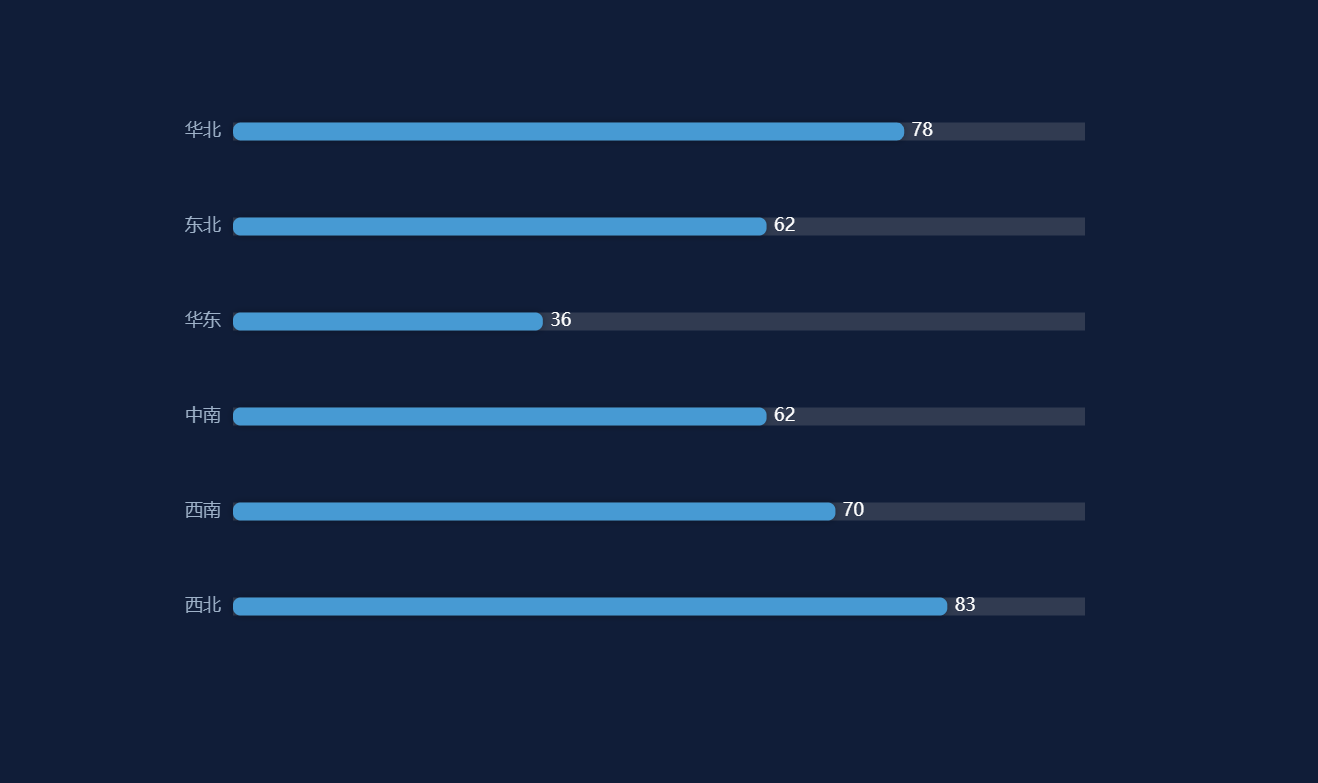
横向柱状图

样式一

效果图

image-20240514172858729

实现代码

复制可用,纵向的交换xAxis和yAxis即可

1
2
3
4
5
6
7
8
9
10
11
12
13
14
15
16
17
18
19
20
21
22
23
24
25
26
27
28
29
30
31
32
33
34
35
36
37
38
39
40
41
42
43
44
45
46
47
48
49
50
51
52
53
54
55
56
57
58
59
60
61
62
63
64
65
66
67
68
69
70
71
72
73
74
75
76
77
78
79
80
81
82
83
84
85
86
87
88
89
90
91
92
93
94
95
96
97
98
99
100
101
102
103
104
105
106
107
108
109
110
111
112
113
114
115
116
117
118
119
120
121
122
123
124
125
126
127
128
129
130
131
132
133
134
135
136
137
138
139
140
141
142
143
144
145
146
147
148
149
150
151
152
153
154
155
156
157
158

<!DOCTYPE html>
<html lang="en">
<head>
<meta charset="UTF-8" />
<meta name="viewport" content="width=device-width, initial-scale=1.0" />
<title>Echart合集</title>
<script src="https://cdn.jsdelivr.net/npm/echarts/dist/echarts.min.js"></script>
<style>
* {
margin: 0;
padding: 0;
}
html,
body {
width: 100%;
height: 100%;
}
body {
display: flex;
align-items: center;
justify-content: center;
background-color: #101d38;
}

#myChart {
width: 600px;
height: 400px;
}
</style>
</head>
<body>
<div id="myChart"></div>

<script>
const myChart = echarts.init(document.getElementById("myChart"));

const data = [
{
id: 1,
name: "华北",
value: 78,
},
{
id: 2,
name: "东北",
value: 62,
},
{
id: 3,
name: "华东",
value: 36,
},
{
id: 4,
name: "中南",
value: 62,
},
{
id: 5,
name: "西南",
value: 70,
},
{
id: 6,
name: "西北",
value: 83,
},
];

const options = {
// X 轴展示数据
xAxis: {
// 数据展示
type: "value",
// 不显示轴
show: false,
// 最大值(防止触顶)
max: function (value) {
// 取整
return parseInt(value.max * 1.2);
},
},
// Y 轴展示选项
yAxis: {
type: "category",
// 根据根据服务端数据筛选
data: data.map((item) => item.name),
// 反向展示
inverse: true,
// 不展示轴线
axisLine: {
show: false,
},
// 不展示刻度
axisTick: {
show: false, // 取消 Y 轴刻度
},
// 文字色值
axisLabel: {
color: "#9EB1C8",
},
},
// echarts 网格绘制的位置,对应 上、右、下、左
grid: {
top: 0,
right: 0,
bottom: 0,
left: 0,
// 计算边距时,包含标签
containLabel: true,
},
// 柱形图核心配置
series: [
{
// 图表类型
type: "bar",
// 数据筛选
data: data.map((item) => ({
name: item.name,
value: item.value,
})),
// 显示背景
showBackground: true,
// 背景色
backgroundStyle: {
color: "rgba(180, 180, 180, 0.2)",
},
// 每个轴的样式
itemStyle: {
color: "#479AD3", // 设置柱子的颜色
barBorderRadius: 5, // 设置柱子的圆角
shadowColor: "rgba(0, 0, 0, 0.3)", // 设置柱子的阴影颜色
shadowBlur: 5, // 设置柱子的阴影模糊大小
},
// 轴宽度,纵向表柱宽
barWidth: 12,
// 轴上的字体
label: {
show: true,
// 设置标签位置为右侧
position: "right",
textStyle: {
// 设置标签文本颜色
color: "#fff",
},
//格式化标签值
formatter: '{c}%'
},
},
],
};

myChart.setOption(options);
</script>
</body>
</html>

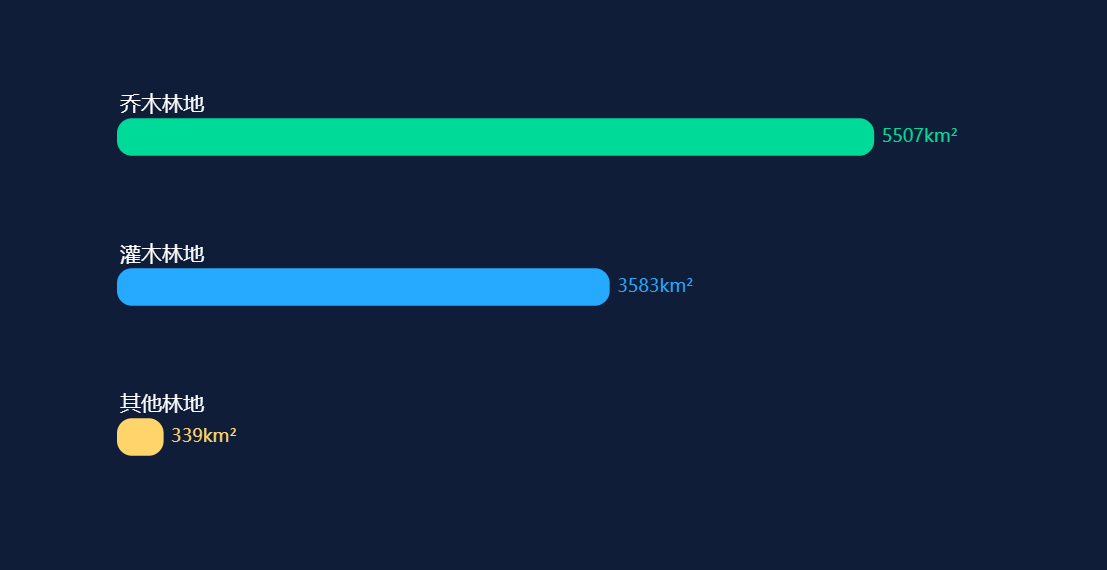
样式二

效果图

image-20240515155406950

实现代码

复制可用

1
2
3
4
5
6
7
8
9
10
11
12
13
14
15
16
17
18
19
20
21
22
23
24
25
26
27
28
29
30
31
32
33
34
35
36
37
38
39
40
41
42
43
44
45
46
47
48
49
50
51
52
53
54
55
56
57
58
59
60
61
62
63
64
65
66
67
68
69
70
71
72
73
74
75
76
77
78
79
80
81
82
83
84
85
86
87
88
89
90
91
92
93
94
95
96
97
98
99
100
101
102
103
104
105
106
107
108
109
110
111
112
113
114
115
<!DOCTYPE html>
<html lang="en">
<head>
<meta charset="UTF-8" />
<meta name="viewport" content="width=device-width, initial-scale=1.0" />
<title>Echart合集</title>
<script src="https://cdn.jsdelivr.net/npm/echarts/dist/echarts.min.js"></script>
<style>
* {
margin: 0;
padding: 0;
}
html,
body {
width: 100%;
height: 100%;
}
body {
display: flex;
align-items: center;
justify-content: center;
background-color: #101d38;
}

#myChart {
width: 600px;
height: 400px;
}
</style>
</head>
<body>
<div id="myChart"></div>
<script>
const myChart = echarts.init(document.getElementById("myChart"));
const options = {
yAxis: {
type: "category",
offset: -10,
position: "left",
inverse: false,
data: ["其他林地", "灌木林地", "乔木林地"],
axisLine: {
show: false, //隐藏y轴
},
axisTick: {
show: false, //刻度线
},
axisLabel: {
show: true,
align: "left",
verticalAlign: "bottom",
lineHeight: 42, //该值调节上下距离,有时多个柱子可能丢失几个label,调一下就行
fontSize: 14,
textStyle: {
color: "#ffffff",
},
},
splitLine: { show: false },
},
xAxis: {
type: "value",
axisLine: {
show: false, //隐藏y轴
},
axisTick: {
show: false, //刻度线
},
axisLabel: {
show: false, //隐藏刻度值
},
splitLine: {
show: false,
}, //刻度分割线
},
series: [
{
data: [339, 3583.0, 5507.0],
type: "bar",
barWidth: 25, //柱子宽
itemStyle: {
normal: {
color: function (params) {
//自定义每个柱子颜色
let colorList = ["#ffd46b", "#25aaff", "#00da98"];
return colorList[params.dataIndex];
},
barBorderRadius: [10, 10, 10, 10], //柱子圆角,分别是四个角
},
},
label: {
//柱子代表值
show: true,
position: "right",
textStyle: {
color: "inherit", //文本与柱子颜色一样
},
formatter: (params) => {
return params.value + "km²"; //格式化,加单位
},
},
},
],
grid: {
//图表大小设置
x: 0, //图表 距离 左边界距离
y: 50, //图表 距离 上边界距离
x2: 50, //图表 距离 右边界距离
y2: 50, //图表 距离 下边界距离
},
};
myChart.setOption(options);
</script>
</body>
</html>

环形图

螺纹效果

效果图

image-20240515092415422

实现代码

直接复制可用

1
2
3
4
5
6
7
8
9
10
11
12
13
14
15
16
17
18
19
20
21
22
23
24
25
26
27
28
29
30
31
32
33
34
35
36
37
38
39
40
41
42
43
44
45
46
47
48
49
50
51
52
53
54
55
56
57
58
59
60
61
62
63
64
65
66
67
68
69
70
71
72
73
74
75
76
77
78
79
80
81
82
83
84
85
86
87
88
89
90
91
92
93
94
95
96
97
98
99
100
101
102
103
104
105
106
107
108
109
110
111
112
113
114
115
116
117
118
119
120
121
122
123
124
125
126
127
128
129
130
131
132
133
134
135
136
137
138
139
140
141
142
143
144
145
146
147
148
149
150
151
152
153
154
155
156
157
158
159
160
161
162
163
164
165
166
167
168
169
170
171
172
173
174
175
176
177
178
179
180
181
182
183
184
185
186
187
188
189
190
191
192
193
194
195
196
197
198
199
200
201
202
203
204
205
206
207
208
209
210
211
212
213
214
215
216
<!DOCTYPE html>
<html lang="en">
<head>
<meta charset="UTF-8" />
<meta name="viewport" content="width=device-width, initial-scale=1.0" />
<title>Echart合集</title>
<script src="https://cdn.jsdelivr.net/npm/echarts/dist/echarts.min.js"></script>
<style>
* {
margin: 0;
padding: 0;
}
html,
body {
width: 100%;
height: 100%;
}
body {
display: flex;
align-items: center;
justify-content: center;
background-color: #101d38;
}

#myChart {
width: 600px;
height: 400px;
}
</style>
</head>
<body>
<div id="myChart"></div>

<script>
const myChart = echarts.init(document.getElementById("myChart"));

const data = [
{
id: 1,
name: "华北",
value: 273,
},
{
id: 2,
name: "东北",
value: 588,
},
{
id: 3,
name: "华东",
value: 657,
},
{
id: 4,
name: "中南",
value: 396,
},
{
id: 5,
name: "西南",
value: 362,
},
];

/**
* 双环形图绘制原理:
* 1. 环形图通过饼图绘制。内外边距的距离减小,即为环形。环形中心点需要不断改变,否则会重叠
* 2. 环形图绘制分为 上层和底层 两部分。上层作为绘制进度,底层作为背景图
* 3. 依据 getSeriesData 生成对应的 上层和底层 series 数据,进行渲染
*/
const getSeriesData = () => {
const series = [];

data.forEach((item, index) => {
// 上层环形绘制
series.push({
name: item.name,
// 使用饼图绘制,减少饼图宽度即为环形图
type: "pie",
// 逆时针排布
clockWise: false,
// 不展示鼠标移入动画
hoverAnimation: false,
// 半径位置,需要依次递减,否则会重复在一处进行展示
radius: [73 - index * 15 + "%", 68 - index * 15 + "%"],
// 中心点
center: ["55%", "55%"],
// 不展示 label
label: { show: false },
// 数据配置
data: [
// 设置数据与名称
{ value: item.value, name: item.name },
// 最大数据,展示比例
{
value: 1000,
name: "",
itemStyle: { color: "rgba(0,0,0,0)", borderWidth: 0 },
tooltip: { show: false },
hoverAnimation: false,
},
],
});

// 底层图
series.push({
name: item.name,
type: "pie",
// 图形不响应事件
silent: true,
// z-index: 置于底层
z: 1,
// 逆时针排布
clockWise: false,
// 不展示鼠标移入动画
hoverAnimation: false,
// 半径位置,需要依次递减,否则会重复在一处进行展示
radius: [73 - index * 15 + "%", 68 - index * 15 + "%"],
// 中心点
center: ["55%", "55%"],
// 不展示 label
label: { show: false },
// 数据
data: [
// 绘制底线 75%
{
value: 7.5,
itemStyle: { color: "rgba(221, 227, 233,0.2)", borderWidth: 0 },
tooltip: { show: false },
hoverAnimation: false,
},
// 绘制底线 25% 透明区域
{
value: 2.5,
name: "",
itemStyle: { color: "rgba(0,0,0,0)", borderWidth: 0 },
tooltip: { show: false },
hoverAnimation: false,
},
],
});
});

return series;
};

const options = {
// 图例配置
legend: {
show: true,
// 图例色块
icon: "circle",
// 位置
top: "20%",
left: "60%",
// 展示数据
data: data.map((item) => item.name),
// 总宽度(一列)
width: -5,
// 每个色块的宽
itemWidth: 10,
// 每个色块的高度
itemHeight: 10,
// 每个色块间距
itemGap: 12,
// 展示内容
formatter: function (name) {
return "{title|" + name + "}";
},
// 字体配置
textStyle: {
rich: {
title: {
fontSize: 12,
lineHeight: 5,
color: "rgba(255,255,255,0.8)",
},
},
},
},
// 提示层
tooltip: {
show: true,
trigger: "item",
formatter: "{a}<br>{b}:{c}({d}%)",
},
// Y 轴展示选项
yAxis: [
{
type: "category",
// 反向展示
inverse: true,
// 不展示轴线
axisLine: {
show: false,
},
// 不展示刻度
axisTick: {
show: false,
},
},
],
// X 轴不展示
xAxis: [
{
show: false,
},
],
// 每两个标记一条线
series: getSeriesData(),
};

myChart.setOption(options);
</script>
</body>
</html>

词云图

基本词云图

效果图

image-20240515094239044

实现代码

由于echarts不带该图类型,所以需要下载。js下载地址,下载源码后我们只需要dist文件里的东西就行,其余可删除

若使用npm方式安装的

echarts5.0以下的版本使用 echarts-wordcloud 1.0

npm install echarts-wordcloud@1

echarts5.0及以上的下载 echarts-wordcloud 2.0

npm install echarts-wordcloud

在需要的地方引用

import 'echarts-wordcloud'

以下为HTML的实现,注意需要自己下载 js 包!!!

1
2
3
4
5
6
7
8
9
10
11
12
13
14
15
16
17
18
19
20
21
22
23
24
25
26
27
28
29
30
31
32
33
34
35
36
37
38
39
40
41
42
43
44
45
46
47
48
49
50
51
52
53
54
55
56
57
58
59
60
61
62
63
64
65
66
67
68
69
70
71
72
73
74
75
76
77
78
79
80
81
82
83
84
85
86
87
88
89
90
91
92
93
94
95
96
97
98
99
100
101
102
103
104
105
106
107
108
109
110
111
112
113
114
115
116
117
118
119
120
121
122
123
124
125
126
127
128
129
130
131
132
133
134
135
136
137
138
139
140
141
142
143
144
145
146
147
148
149
150
151
152
153
154
155
156
157
158
159
160
161
162
163
164
165
166
<!DOCTYPE html>
<html lang="en">
<head>
<meta charset="UTF-8" />
<meta name="viewport" content="width=device-width, initial-scale=1.0" />
<title>Echart合集</title>
<script src="https://cdn.jsdelivr.net/npm/echarts/dist/echarts.min.js"></script>
<!-- 本地echarts-wordcloud包引入 -->
<script src="./lib/echarts-wordcloud-master/dist/echarts-wordcloud.min.js"></script>
<style>
* {
margin: 0;
padding: 0;
}
html,
body {
width: 100%;
height: 100%;
}
body {
display: flex;
align-items: center;
justify-content: center;
background-color: #101d38;
}

#myChart {
width: 600px;
height: 400px;
}
</style>
</head>
<body>
<div id="myChart"></div>

<script>
const myChart = echarts.init(document.getElementById("myChart"));

const data = [
{
value: 37,
name: "企联网",
},
{
value: 40,
name: "智农通",
},
{
value: 13,
name: "OPPO",
},
{
value: 18,
name: "HONOR",
},
{
value: 45,
name: "红米",
},
{
value: 48,
name: "小米",
},
{
value: 31,
name: "美图",
},
{
value: 39,
name: "ONEPLUS",
},
{
value: 21,
name: "魅族",
},
{
value: 21,
name: "红手指",
},
{
value: 40,
name: "SAMSUNG",
},
{
value: 38,
name: "金立",
},
{
value: 33,
name: "BLACKBERRY",
},
{
value: 27,
name: "诺基亚",
},
{
value: 11,
name: "锤子",
},
{
value: 22,
name: "大疆",
},
{
value: 15,
name: "361",
},
{
value: 18,
name: "摩托罗拉",
},
{
value: 19,
name: "联想",
},
{
value: 25,
name: "玩家国度",
},
];

/**
* 生成随机色值
*/
const randomRGB = () => {
const r = Math.floor(Math.random() * 255);
const g = Math.floor(Math.random() * 255);
const b = Math.floor(Math.random() * 255);
return `rgb(${r}, ${g}, ${b})`;
};

const options = {
series: [
{
// 类型
type: "wordCloud",
// 数据映射文本的大小范围
sizeRange: [8, 46],
// 文字旋转范围
rotationRange: [0, 0],
// 单词之间的间距
gridSize: 0,
// 渲染动画
layoutAnimation: true,
// 字体
textStyle: {
// 随机色值
color: randomRGB,
},
// 高亮字体
emphasis: {
textStyle: {
fontWeight: "bold",
color: "#000",
},
},
// 数据
data: data,
},
],
};

myChart.setOption(options);
</script>
</body>
</html>

官网例子

[网地址:https://github.com/ecomfe/echarts-wordcloud?tab=readme-ov-file

1
2
3
4
5
6
7
8
9
10
11
12
13
14
15
16
17
18
19
20
21
22
23
24
25
26
27
28
29
30
31
32
33
34
35
36
37
38
39
40
41
42
43
44
45
46
47
48
49
50
51
52
53
54
55
56
57
58
59
60
61
62
63
64
65
66
67
68
69
70
71
72
73
74
75
76
77
78
79
80
81
82
83
84
85
86
87
88
89
90
91
92
93
94
95
96
var chart = echarts.init(document.getElementById('main'));

chart.setOption({
...
series: [{
type: 'wordCloud',

// The shape of the "cloud" to draw. Can be any polar equation represented as a
// callback function, or a keyword present. Available presents are circle (default),
// cardioid (apple or heart shape curve, the most known polar equation), diamond (
// alias of square), triangle-forward, triangle, (alias of triangle-upright, pentagon, and star.

shape: 'circle',

// Keep aspect ratio of maskImage or 1:1 for shapes
// This option is supported since echarts-wordcloud@2.1.0
keepAspect: false,

// A silhouette image which the white area will be excluded from drawing texts.
// The shape option will continue to apply as the shape of the cloud to grow.

maskImage: maskImage,

// Folllowing left/top/width/height/right/bottom are used for positioning the word cloud
// Default to be put in the center and has 75% x 80% size.

left: 'center',
top: 'center',
width: '70%',
height: '80%',
right: null,
bottom: null,

// Text size range which the value in data will be mapped to.
// Default to have minimum 12px and maximum 60px size.

sizeRange: [12, 60],

// Text rotation range and step in degree. Text will be rotated randomly in range [-90, 90] by rotationStep 45

rotationRange: [-90, 90],
rotationStep: 45,

// size of the grid in pixels for marking the availability of the canvas
// the larger the grid size, the bigger the gap between words.

gridSize: 8,

// set to true to allow word to be drawn partly outside of the canvas.
// Allow word bigger than the size of the canvas to be drawn
// This option is supported since echarts-wordcloud@2.1.0
drawOutOfBound: false,

// if the font size is too large for the text to be displayed,
// whether to shrink the text. If it is set to false, the text will
// not be rendered. If it is set to true, the text will be shrinked.
// This option is supported since echarts-wordcloud@2.1.0
shrinkToFit: false,

// If perform layout animation.
// NOTE disable it will lead to UI blocking when there is lots of words.
layoutAnimation: true,

// Global text style
textStyle: {
fontFamily: 'sans-serif',
fontWeight: 'bold',
// Color can be a callback function or a color string
color: function () {
// Random color
return 'rgb(' + [
Math.round(Math.random() * 160),
Math.round(Math.random() * 160)
].join(',') + ')';
}
},
emphasis: {
focus: 'self',

textStyle: {
textShadowBlur: 10,
textShadowColor: '#333'
}
},

// Data is an array. Each array item must have name and value property.
data: [{
name: 'Farrah Abraham',
value: 366,
// Style of single text
textStyle: {
}
}]
}]
});

雷达图

基本雷达图

效果图

image-20240515095333381

实现代码

复制直接可用

1
2
3
4
5
6
7
8
9
10
11
12
13
14
15
16
17
18
19
20
21
22
23
24
25
26
27
28
29
30
31
32
33
34
35
36
37
38
39
40
41
42
43
44
45
46
47
48
49
50
51
52
53
54
55
56
57
58
59
60
61
62
63
64
65
66
67
68
69
70
71
72
73
74
75
76
77
78
79
80
81
82
83
84
85
86
87
88
89
90
91
92
93
94
95
96
97
98
99
100
101
102
103
104
105
106
107
108
109
110
111
112
113
114
115
116
117
118
119
120
121
122
123
124
125
126
127
128
129
130
131
132
133
134
135
136
137
138
139
140
141
142
143
144
145
146
147
148
149
150
151
152
153
154
155
156
157
158
159
160
161
162
163
164
165
166
167
168
169
170
171
172
173
174
175
176
177
178
179
180
181
182
183
184
185
186
187
188
189
190
191
192
193
194
195
196
197
198
199
200
201
<!DOCTYPE html>
<html lang="en">
<head>
<meta charset="UTF-8" />
<meta name="viewport" content="width=device-width, initial-scale=1.0" />
<title>Echart合集</title>
<script src="https://cdn.jsdelivr.net/npm/echarts/dist/echarts.min.js"></script>
<style>
* {
margin: 0;
padding: 0;
}
html,
body {
width: 100%;
height: 100%;
}
body {
display: flex;
align-items: center;
justify-content: center;
background-color: #101d38;
}

#myChart {
width: 600px;
height: 400px;
}
</style>
</head>
<body>
<div id="myChart"></div>

<script>
const myChart = echarts.init(document.getElementById("myChart"));

const data = [
{
id: 1,
name: "华北",
value: 75,
},
{
id: 2,
name: "东北",
value: 37,
},
{
id: 3,
name: "华东",
value: 36,
},
{
id: 4,
name: "中南",
value: 56,
},
{
id: 5,
name: "西南",
value: 70,
},
{
id: 6,
name: "西北",
value: 67,
},
];
const options = {
// 雷达图坐标系配置
radar: {
// 坐标系名
name: {
textStyle: {
color: "#05D5FF",
fontSize: 14,
},
},
// 雷达绘制类型。polygon 多边形
shape: "polygon",
// 居中
center: ["50%", "50%"],
// 边境
radius: "80%",
// 开始的角度(可以避免绘制到边框之外)
startAngle: 120,
// 轴线配置
axisLine: {
lineStyle: {
color: "rgba(5, 213, 255, .8)",
},
},
// 网格线配置
splitLine: {
show: true,
lineStyle: {
width: 1,
color: "rgba(5, 213, 255, .8)", // 设置网格的颜色
},
},
// 指示器文字
indicator: data.map((item) => ({
name: item.name,
max: 100,
})),
// 不展示拆分区域
splitArea: {
show: false,
},
},
// 坐标居中
polar: {
center: ["50%", "50%"], // 默认全局居中
radius: "0%",
},
// 坐标角度
angleAxis: {
// 坐标轴刻度最小值
min: 0,
// 坐标轴分割间隔
interval: 5,
// 刻度增长逆时针
clockwise: false,
// 不显示坐标轴刻度
axisTick: {
show: false,
},
// 不显示坐标轴文字
axisLabel: {
show: false,
},
// 不显示坐标轴线
axisLine: {
show: false,
},
// 不显示分割线
splitLine: {
show: false,
},
},
// 径向轴
radiusAxis: {
// 最小值
min: 0,
// 间隔
interval: 20,
// 不显示分割线
splitLine: {
show: true,
},
},
// 图表核心配置
series: [
{
// 雷达图
type: "radar",
// 拐点的样式,还可以取值'rect','angle'等
symbol: "circle",
// 拐点的大小
symbolSize: 10,
// 折线拐点标志的样式
itemStyle: {
normal: {
color: "#05D5FF",
},
},
// 区域填充样式
areaStyle: {
normal: {
color: "#05D5FF",
opacity: 0.5,
},
},
// 线条样式
lineStyle: {
width: 2,
color: "#05D5FF",
},
// 图形上的文本标签
label: {
normal: {
show: true,
formatter: (params) => {
return params.value;
},
color: "#fff",
},
},
// 数据
data: [
{
value: data.map((item) => item.value),
},
],
},
],
};
myChart.setOption(options);
</script>
</body>
</html>

关系型图

点对点

效果图

image-20240515095909087

实现代码

直接复制可用

1
2
3
4
5
6
7
8
9
10
11
12
13
14
15
16
17
18
19
20
21
22
23
24
25
26
27
28
29
30
31
32
33
34
35
36
37
38
39
40
41
42
43
44
45
46
47
48
49
50
51
52
53
54
55
56
57
58
59
60
61
62
63
64
65
66
67
68
69
70
71
72
73
74
75
76
77
78
79
80
81
82
83
84
85
86
87
88
89
90
91
92
93
94
95
96
97
98
99
100
101
102
103
104
105
106
107
108
109
110
111
112
113
114
115
116
117
118
119
120
121
122
123
124
125
126
127
128
129
130
131
132
133
134
135
136
137
138
139
140
141
142
143
144
145
146
147
148
149
150
151
152
153
154
155
156
157
158
159
160
161
162
163
164
165
166
167
168
169
170
171
172
173
174
175
176
177
178
179
180
181
182
183
184
185
186
187
188
189
190
191
192
193
194
195
196
197
198
199
200
201
202
203
204
205
206
207
208
209
210
211
212
213
214
215
216
217
218
219
<!DOCTYPE html>
<html lang="en">
<head>
<meta charset="UTF-8" />
<meta name="viewport" content="width=device-width, initial-scale=1.0" />
<title>Echart合集</title>
<script src="https://cdn.jsdelivr.net/npm/echarts/dist/echarts.min.js"></script>
<style>
* {
margin: 0;
padding: 0;
}
html,
body {
width: 100%;
height: 100%;
}
body {
display: flex;
align-items: center;
justify-content: center;
background-color: #101d38;
}

#myChart {
width: 600px;
height: 400px;
}
</style>
</head>
<body>
<div id="myChart"></div>

<script>
const myChart = echarts.init(document.getElementById("myChart"));

const data = [
{
id: 1,
name: "上级平台1",
source: "上级平台1",
target: "数据中心",
speed: 140,
value: [0, 300],
},
{
id: 2,
name: "上级平台2",
source: "上级平台2",
target: "数据中心",
speed: 140,
value: [0, 100],
},
{
id: 3,
name: "子级平台1",
source: "数据中心",
target: "子级平台1",
speed: 199,
value: [100, 100],
},
{
id: 4,
name: "子级平台2",
source: "数据中心",
target: "子级平台2",
speed: 89,
value: [100, 300],
},
{
id: 0,
name: "数据中心",
speed: 53,
value: [50, 200],
},
];
const options = {
// X 轴不需要展示
xAxis: {
show: false,
type: "value",
},
// X 轴不需要展示
yAxis: {
show: false,
type: "value",
},
// 核心数据配置
series: [
{
// 用于展现节点以及节点之间的关系数据
type: "graph",
// 不采用任何布局
layout: "none",
// 使用二维的直角坐标系
coordinateSystem: "cartesian2d",
// 节点标记的大小
symbolSize: 26,
// z-index
z: 3,
// 边界标签(线条文字)
edgeLabel: {
normal: {
show: true,
color: "#fff",
textStyle: {
fontSize: 14,
},
formatter: function (params) {
let txt = "";
if (params.data.speed !== undefined) {
txt = params.data.speed;
}
return txt;
},
},
},
// 圆饼下文字
label: {
normal: {
show: true,
position: "bottom",
color: "#5e5e5e",
},
},
// 边两端的标记类型
edgeSymbol: ["none", "arrow"],
// 边两端的标记大小
edgeSymbolSize: 8,
// 圆数据
data: data.map((item) => {
// id 为 0 ,表示数据中心,数据中心单独设置
if (item.id !== 0) {
return {
name: item.name,
category: 0,
active: true,
speed: `${item.speed}kb/s`,
// 位置
value: item.value,
};
} else {
return {
name: item.name,
// 位置
value: item.value,
// 数据中心圆的大小
symbolSize: 100,
// 圆的样式
itemStyle: {
normal: {
// 渐变色
color: {
colorStops: [
{ offset: 0, color: "#157eff" },
{ offset: 1, color: "#35c2ff" },
],
},
},
},
// 字体
label: { normal: { fontSize: "14" } },
};
}
}),
// 线
links: data.map((item, index) => ({
// 方向
source: item.source,
target: item.target,
// 线上的文字
speed: `${item.speed}kb/s`,
// 线的样式
lineStyle: { normal: { color: "#12b5d0", curveness: 0.2 } },
// 文字位置
label: {
show: true,
position: "middle",
offset: [10, 0],
},
})),
},
{
// 用于带有起点和终点信息的线数据的绘制
type: "lines",
// 使用二维的直角坐标系
coordinateSystem: "cartesian2d",
// z-index
z: 1,
// 线特效的配置
effect: {
show: true,
smooth: false,
trailLength: 0,
symbol: "arrow",
color: "rgba(55,155,255,0.5)",
symbolSize: 12,
},
// 线的样式
lineStyle: {
normal: {
curveness: 0.2,
},
},
// 线的数据级,前后线需要重合。数据固定
data: [
[{ coord: [0, 300] }, { coord: [50, 200] }],
[{ coord: [0, 100] }, { coord: [50, 200] }],
[{ coord: [50, 200] }, { coord: [100, 100] }],
[{ coord: [50, 200] }, { coord: [100, 300] }],
],
},
],
};

myChart.setOption(options);
</script>
</body>
</html>

数据总览

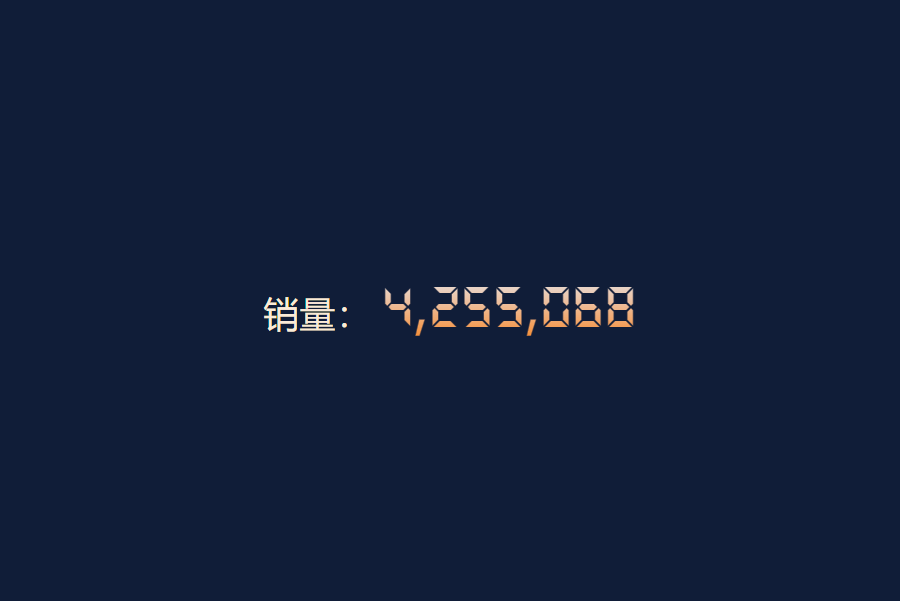
文本滚动特效

效果图

image-20240515103309700

实现代码

  1. 借助countUp.js库实现动效

原生HTML,可以下载js,或者在线引入CDN地址,详情查看官网地址

npm引入 npm i --save countup.js@2.6.2

  1. 引入特殊字体

上面的字体效果可根据美工提供字体进行更换

1
2
3
4
5
6
7
8
9
10
/** 加入字体 */
@font-face {
font-family: "Electronic";
src: url(./lib/fonts/FX-LED.ttf);
}

/** 使用字体 */
#nums {
font-family: "Electronic";
}
  1. 设置渐变
1
2
3
4
5
6
7
8
.text-gradient {
/** 渐变色 */
background-image: linear-gradient(to bottom, #e4e4e8, #f58e31);
/* 背景延伸至文字 */
-webkit-background-clip: text;
/* 文字透明 */
-webkit-text-fill-color: transparent;
}
  1. 原生HTML代码实现,复制可用
1
2
3
4
5
6
7
8
9
10
11
12
13
14
15
16
17
18
19
20
21
22
23
24
25
26
27
28
29
30
31
32
33
34
35
36
37
38
39
40
41
42
43
44
45
46
47
48
49
50
51
52
53
54
55
56
57
58
59
60
61
62
63
64
65
66
67
68
69
70
71
72
73
74
75
76
77
78
79
80
81
82
83
84
85
86
87
<!DOCTYPE html>
<html lang="en">
<head>
<meta charset="UTF-8" />
<meta name="viewport" content="width=device-width, initial-scale=1.0" />
<title>特殊动效字体</title>
<script src="https://cdn.bootcss.com/countup.js/1.9.3/countUp.js"></script>
<style>
* {
margin: 0;
padding: 0;
}
html,
body {
width: 100%;
height: 100%;
}
body {
display: flex;
align-items: center;
justify-content: center;
background-color: #101d38;
}

#container {
width: 600px;
height: 400px;
display: flex;
color: antiquewhite;
font-size: 24px;
justify-content: center;
align-items: center;
}

#nums {
font-size: 42px;
font-family: "Electronic";
}

/* 文字渐变 */
.text-gradient {
background-image: linear-gradient(to bottom, #e4e4e8, #f58e31);
/* 背景延伸至文字 */
-webkit-background-clip: text;
/* 文字透明 */
-webkit-text-fill-color: transparent;
}

/* 加入特殊字体 */
@font-face {
font-family: "Electronic";
src: url(./lib/fonts/FX-LED.ttf);
}
</style>
</head>
<body>
<div id="container">
<div>
销量:
<span id="nums" class="text-gradient">0</span>
</div>
</div>

<script type="text/javascript">
/**
*
target = 目标元素的 ID;
startVal = 开始值;
endVal = 结束值;
decimals = 小数位数,默认值是0;
duration = 动画延迟秒数,默认值是2;
* */
const options = {
useEasing: true,
useGrouping: true,
separator: ",",
decimal: ".",
};
const demo = new CountUp("nums", 0, 4255068, 0, 2.5, options);
if (!demo.error) {
demo.start();
} else {
console.error(demo.error);
}
</script>
</body>
</html>
  1. npm方式导入的方式使用,如下vue示例,只展示countup.js使用,其余样式等同上。记得先安装npm i --save countup.js@2.6.2
1
2
3
4
5
6
7
8
9
10
11
12
13
14
15
16
17
18
<template>
<span ref="numRef">0</span>
</template>

<script setup>
import { CountUp } from 'countup.js'

const numRef = ref(null)

const data = 8778988

onMounted(() => {
// 简单使用 new CountUp(元素,数值)
new CountUp(numRef.value,data).start()
})

</script>

时间线切换

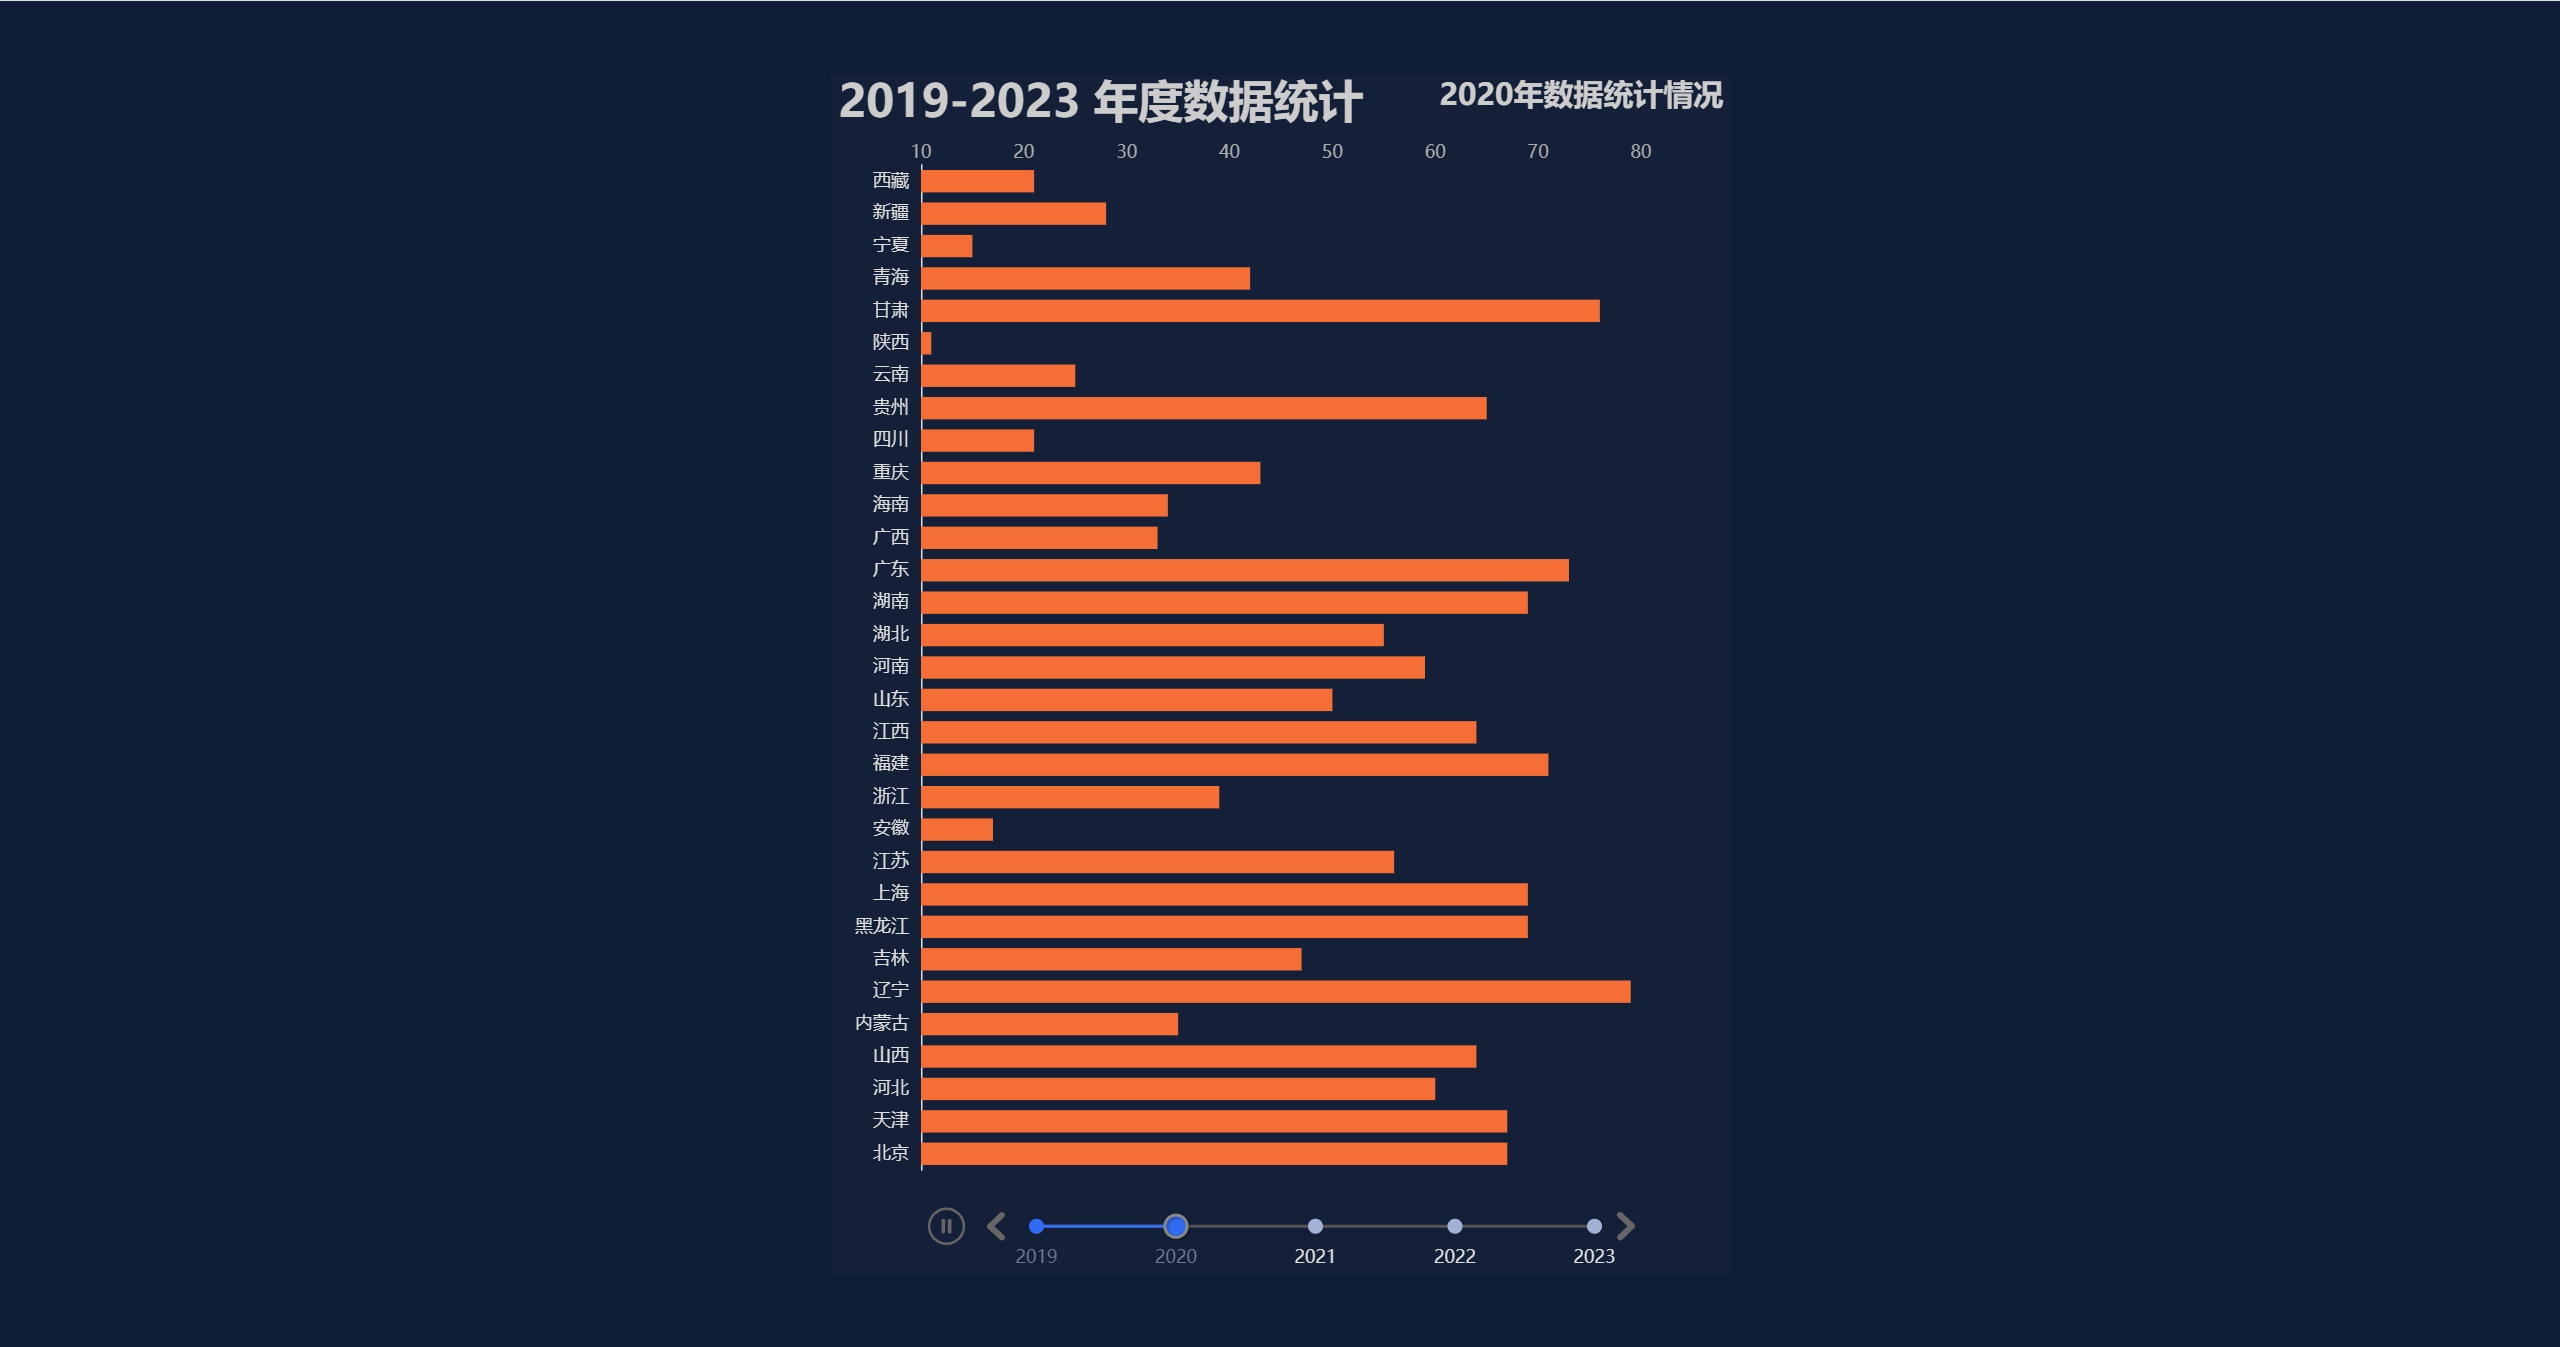
柱状图

实现效果

image-20240515111102561

实现代码

直接复制可用,示例代码数据做了精简只保留了两个省份。

1
2
3
4
5
6
7
8
9
10
11
12
13
14
15
16
17
18
19
20
21
22
23
24
25
26
27
28
29
30
31
32
33
34
35
36
37
38
39
40
41
42
43
44
45
46
47
48
49
50
51
52
53
54
55
56
57
58
59
60
61
62
63
64
65
66
67
68
69
70
71
72
73
74
75
76
77
78
79
80
81
82
83
84
85
86
87
88
89
90
91
92
93
94
95
96
97
98
99
100
101
102
103
104
105
106
107
108
109
110
111
112
113
114
115
116
117
118
119
120
121
122
123
124
125
126
127
128
129
130
131
132
133
134
135
136
137
138
139
140
141
142
143
144
145
146
147
148
149
150
151
152
153
154
155
156
157
158
159
160
161
162
163
164
165
166
167
168
169
170
171
172
173
174
175
176
177
178
179
180
181
182
183
184
185
186
187
188
189
190
191
192
193
194
195
196
197
198
199
200
201
202
203
204
205
206
207
208
209
210
211
212
213
214
215
216
217
218
219
220
221
222
223
224
225
226
227
228
229
230
231
232
233
234
235
236
237
238
239
240
241
242
243
244
245
246
247
248
249
250
251
252
253
254
255
256
257
258
259
260
261
262
263
264
265
266
267
268
269
270
271
272
273
274
275
276
277
278
279
280
281
282
283
284
285
286
287
288
<!DOCTYPE html>
<html lang="en">
<head>
<meta charset="UTF-8" />
<meta name="viewport" content="width=device-width, initial-scale=1.0" />
<title>Echart合集</title>
<script src="https://cdn.jsdelivr.net/npm/echarts/dist/echarts.min.js"></script>
<style>
* {
margin: 0;
padding: 0;
}
html,
body {
width: 100%;
height: 100%;
}
body {
display: flex;
align-items: center;
justify-content: center;
background-color: #101d38;
}

#myChart {
width: 600px;
height: 800px;
}
</style>
</head>
<body>
<div id="myChart"></div>

<script>
const myChart = echarts.init(document.getElementById("myChart"));

const data = {
voltageLevel: ["2019", "2020", "2021", "2022", "2023"],
colors: [
"#1DE9B6",
"#F46E36",
"#04B9FF",
"#5DBD32",
"#FFC809",
"#FB95D5",
"#BDA29A",
"#6E7074",
"#546570",
"#C4CCD3",
],
categoryData: {
2019: [
{
name: "北京",
value: 35,
},
{
name: "天津",
value: 11,
},
],
2020: [
{
name: "北京",
value: 67,
},
{
name: "天津",
value: 67,
},
],
2021: [
{
name: "北京",
value: 40,
},
{
name: "天津",
value: 75,
},
],
2022: [
{
name: "北京",
value: 42,
},
{
name: "天津",
value: 62,
},
],
2023: [
{
name: "北京",
value: 46,
},
{
name: "天津",
value: 70,
},
],
},
};

let options = {
// 时间线,提供了在多个 ECharts option 间进行切换
timeline: {
// 数据
data: data.voltageLevel,
// 类目轴
axisType: "category",
// 自动切换
autoPlay: true,
// 间隔时间
playInterval: 3000,
// 位置
left: "10%",
right: "10%",
bottom: "0%",
width: "80%",
// 轴的文本标签
label: {
// 默认状态
normal: {
textStyle: {
color: "#ddd",
},
},
// 高亮状态
emphasis: {
textStyle: {
color: "#fff",
},
},
},
// 文字大小
symbolSize: 10,
// 线的样式
lineStyle: {
color: "#555",
},
// 选中点的样式
checkpointStyle: {
borderColor: "#888",
borderWidth: 2,
},
// 控件样式
controlStyle: {
// 上一步按钮
showNextBtn: true,
// 下一步按钮
showPrevBtn: true,
// 默认样式
normal: {
color: "#666",
borderColor: "#666",
},
// 高亮样式
emphasis: {
color: "#aaa",
borderColor: "#aaa",
},
},
},


baseOption: {
// 柱形图位置设置
grid: {
// right: "2%",
// top: "15%",
// bottom: "10%",
// width: "20%",
},
},
// 绑定时间轴的多个图表
options: [],
};

// 为每一年度的图表添加数据
data.voltageLevel.forEach((item, index) => {
options.options.push({
// 背景色
backgroundColor: "#142037",
title: [
// 主标题
{
text: "2019-2023 年度数据统计",
left: "0%",
top: "0",
textStyle: {
color: "#ccc",
fontSize: 30,
},
},
// 副标题
{
id: "statistic",
text: item + "年数据统计情况",
right: "0%",
top: "0%",
textStyle: {
color: "#ccc",
fontSize: 20,
},
},
],
// X 轴配置
xAxis: {
// 数据轴
type: "value",
// 脱离 0 值比例
scale: true,
// 位置
position: "top",
// 不显示分割线
splitLine: {
show: false,
},
// 不显示轴线
axisLine: {
show: false,
},
// 不显示刻度尺
axisTick: {
show: false,
},
// 类别文字
axisLabel: {
margin: 2,
textStyle: {
color: "#aaa",
},
},
},
// Y 轴
yAxis: {
// 选项轴
type: "category",
// 轴线
axisLine: {
show: true,
lineStyle: {
color: "#ddd",
},
},
// 轴刻度
axisTick: {
show: false,
lineStyle: {
color: "#ddd",
},
},
// 轴标签
axisLabel: {
interval: 0,
textStyle: {
color: "#ddd",
},
},
// 根据年份,获取对应数据
data: data.categoryData[item].map((item) => item.name),
},
// 核心配置
series: [
// 柱形图
{
zlevel: 1.5,
// 柱形图
type: "bar",
// 每个柱子的色值
itemStyle: {
normal: {
color: data.colors[index],
},
},
// 根据年份,获取对应数据
data: data.categoryData[item].map((item) => item.value),
},
],
});
});

myChart.setOption(options);
</script>
</body>
</html>

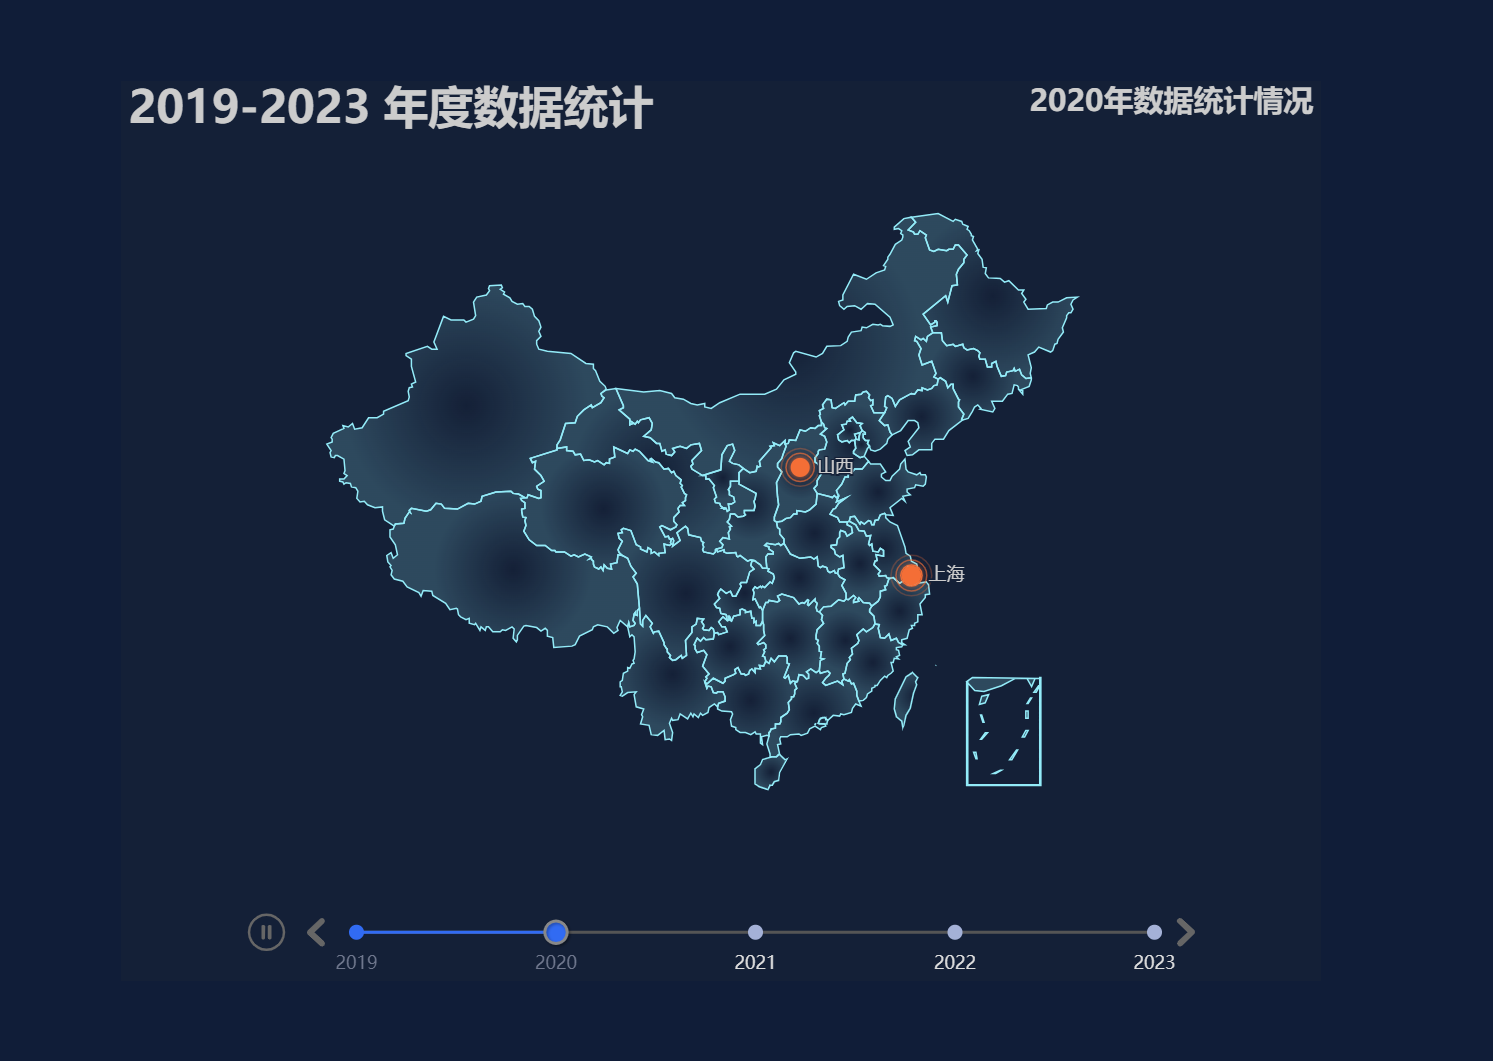
散点图

实现效果

image-20240515141257413

实现代码

复制可用,下面代码中引用了一个中国区域的json数据,该数据可以在阿里的可视化平台生成链接或下载,传送门

下面数组同效果图做了缩减

1
2
3
4
5
6
7
8
9
10
11
12
13
14
15
16
17
18
19
20
21
22
23
24
25
26
27
28
29
30
31
32
33
34
35
36
37
38
39
40
41
42
43
44
45
46
47
48
49
50
51
52
53
54
55
56
57
58
59
60
61
62
63
64
65
66
67
68
69
70
71
72
73
74
75
76
77
78
79
80
81
82
83
84
85
86
87
88
89
90
91
92
93
94
95
96
97
98
99
100
101
102
103
104
105
106
107
108
109
110
111
112
113
114
115
116
117
118
119
120
121
122
123
124
125
126
127
128
129
130
131
132
133
134
135
136
137
138
139
140
141
142
143
144
145
146
147
148
149
150
151
152
153
154
155
156
157
158
159
160
161
162
163
164
165
166
167
168
169
170
171
172
173
174
175
176
177
178
179
180
181
182
183
184
185
186
187
188
189
190
191
192
193
194
195
196
197
198
199
200
201
202
203
204
205
206
207
208
209
210
211
212
213
214
215
216
217
218
219
220
221
222
223
224
225
226
227
228
229
230
231
232
233
234
235
236
237
238
239
240
241
242
243
244
245
246
247
248
249
250
251
252
253
254
255
256
257
258
259
260
261
262
263
264
265
266
267
268
269
270
271
272
273
274
275
276
277
278
279
280
281
282
283
284
285
286
287
288
289
290
291
292
293
294
295
296
297
298
299
300
301
302
303
304
305
306
307
308
309
310
311
312
313
314
315
316
317
318
319
320
321
322
323
324
325
326
327
<!DOCTYPE html>
<html lang="en">
<head>
<meta charset="UTF-8" />
<meta name="viewport" content="width=device-width, initial-scale=1.0" />
<title>Echart合集</title>
<script src="https://cdn.jsdelivr.net/npm/echarts/dist/echarts.min.js"></script>
<style>
* {
margin: 0;
padding: 0;
}
html,
body {
width: 100%;
height: 100%;
}
body {
display: flex;
align-items: center;
justify-content: center;
background-color: #101d38;
}

#myChart {
width: 800px;
height: 600px;
}
</style>
</head>
<body>
<div id="myChart"></div>
<script>
const xhr = new XMLHttpRequest();
xhr.open("GET", "https://geo.datav.aliyun.com/areas_v3/bound/100000_full.json", true);
xhr.send();
xhr.onload = function () {
if (xhr.status === 200) {
const data = JSON.parse(xhr.responseText);
render(data);
}
};
// 图表渲染函数
const render = (MapJson) => {
echarts.registerMap("china", MapJson);

const myChart = echarts.init(document.getElementById("myChart"));

const data = {
voltageLevel: ["2019", "2020", "2021", "2022", "2023"],
colors: [
"#1DE9B6",
"#F46E36",
"#04B9FF",
"#5DBD32",
"#FFC809",
"#FB95D5",
"#BDA29A",
"#6E7074",
"#546570",
"#C4CCD3",
],
topData: {
2019: [
{
name: "天津",
value: [117.4219, 39.4189, 84.1],
},
{
name: "河北",
value: [114.4995, 38.1006, 82.4],
},
],
2020: [
{
name: "上海",
value: [121.4648, 31.2891, 51.9],
},
{
name: "山西",
value: [112.3352, 37.9413, 50.7],
},
],
2021: [
{
name: "北京",
value: [116.4551, 40.2539, 69.5],
},

{
name: "山西",
value: [112.3352, 37.9413, 50.4],
},
],
2022: [
{
name: "河南",
value: [113.4668, 34.6234, 61],
},

{
name: "湖北",
value: [114.3896, 30.6628, 48.5],
},
],
2023: [
{
name: "陕西",
value: [109.1162, 34.2004, 44.2],
},
{
name: "山西",
value: [112.3352, 37.9413, 43.9],
},
],
},
};

let options = {
// 时间线,提供了在多个 ECharts option 间进行切换
timeline: {
// 数据
data: data.voltageLevel,
// 类目轴
axisType: "category",
// 自动切换
autoPlay: true,
// 间隔时间
playInterval: 3000,
// 位置
left: "10%",
right: "10%",
bottom: "0%",
width: "80%",
// 轴的文本标签
label: {
// 默认状态
normal: {
textStyle: {
color: "#ddd",
},
},
// 高亮状态
emphasis: {
textStyle: {
color: "#fff",
},
},
},
// 文字大小
symbolSize: 10,
// 线的样式
lineStyle: {
color: "#555",
},
// 选中点的样式
checkpointStyle: {
borderColor: "#888",
borderWidth: 2,
},
// 控件样式
controlStyle: {
// 上一步按钮
showNextBtn: true,
// 下一步按钮
showPrevBtn: true,
// 默认样式
normal: {
color: "#666",
borderColor: "#666",
},
// 高亮样式
emphasis: {
color: "#aaa",
borderColor: "#aaa",
},
},
},

baseOption: {
// 中国地图
geo: {
// 展示
show: true,
// 中国地图
map: "china",
// 开启缩放
roam: true,
// 初始缩放
zoom: 0.8,
// 地图中心点(可用来控制地图在图表容器的位置)
center: [105.83531246, 34.0267395887],
// 默认状态的省份样式
itemStyle: {
normal: {
// 边框色值
borderColor: "rgba(147, 235, 248, 1)",
// 边框宽度
borderWidth: 1,
// 区域颜色
areaColor: {
// 经向色值
type: "radial",
x: 0.5,
y: 0.5,
r: 0.5,
colorStops: [
// 0% 处的颜色
{
offset: 0,
color: "rgba(147, 235, 248, 0)",
},
// 100% 处的颜色
{
offset: 1,
color: "rgba(147, 235, 248, .2)",
},
],
// 缺省为 false
globalCoord: false,
},
},
// 鼠标移入的色值
emphasis: {
areaColor: "#389BB7",
borderWidth: 0,
},
},
},
},
// 绑定时间轴的多个图表
options: [],
};

// 为每一年度的图表添加数据
data.voltageLevel.forEach((item, index) => {
options.options.push({
// 背景色
backgroundColor: "#142037",
title: [
// 主标题
{
text: "2019-2023 年度数据统计",
left: "0%",
top: "0",
textStyle: {
color: "#ccc",
fontSize: 30,
},
},
// 副标题
{
id: "statistic",
text: item + "年数据统计情况",
right: "0%",
top: "0%",
textStyle: {
color: "#ccc",
fontSize: 20,
},
},
],
// X 轴配置
xAxis: {
// 不显示分割线
splitLine: {
show: false,
},
// 不显示轴线
axisLine: {
show: false,
},
},
// Y 轴
yAxis: {
// 不显示轴线
axisLine: {
show: false,
},
},
// 核心配置
series: [
// 散点图
{
// 散点(气泡)图
type: "effectScatter",
// 使用地理坐标系
coordinateSystem: "geo",
// 数据
data: data.topData[item],
// 标记大小
symbolSize: function (val) {
return val[2] / 4;
},
// 绘制完成后显示特效
showEffectOn: "render",
// 展示涟漪特效
rippleEffect: {
brushType: "stroke",
},
// 文字
label: {
normal: {
formatter: "{b}",
position: "right",
show: true,
},
},
// 每一项的配置
itemStyle: {
normal: {
color: data.colors[index],
// 阴影配置
shadowBlur: 5,
shadowColor: data.colors[index],
},
},
zlevel: 1,
},
],
});
});
myChart.setOption(options);
};
</script>
</body>
</html>

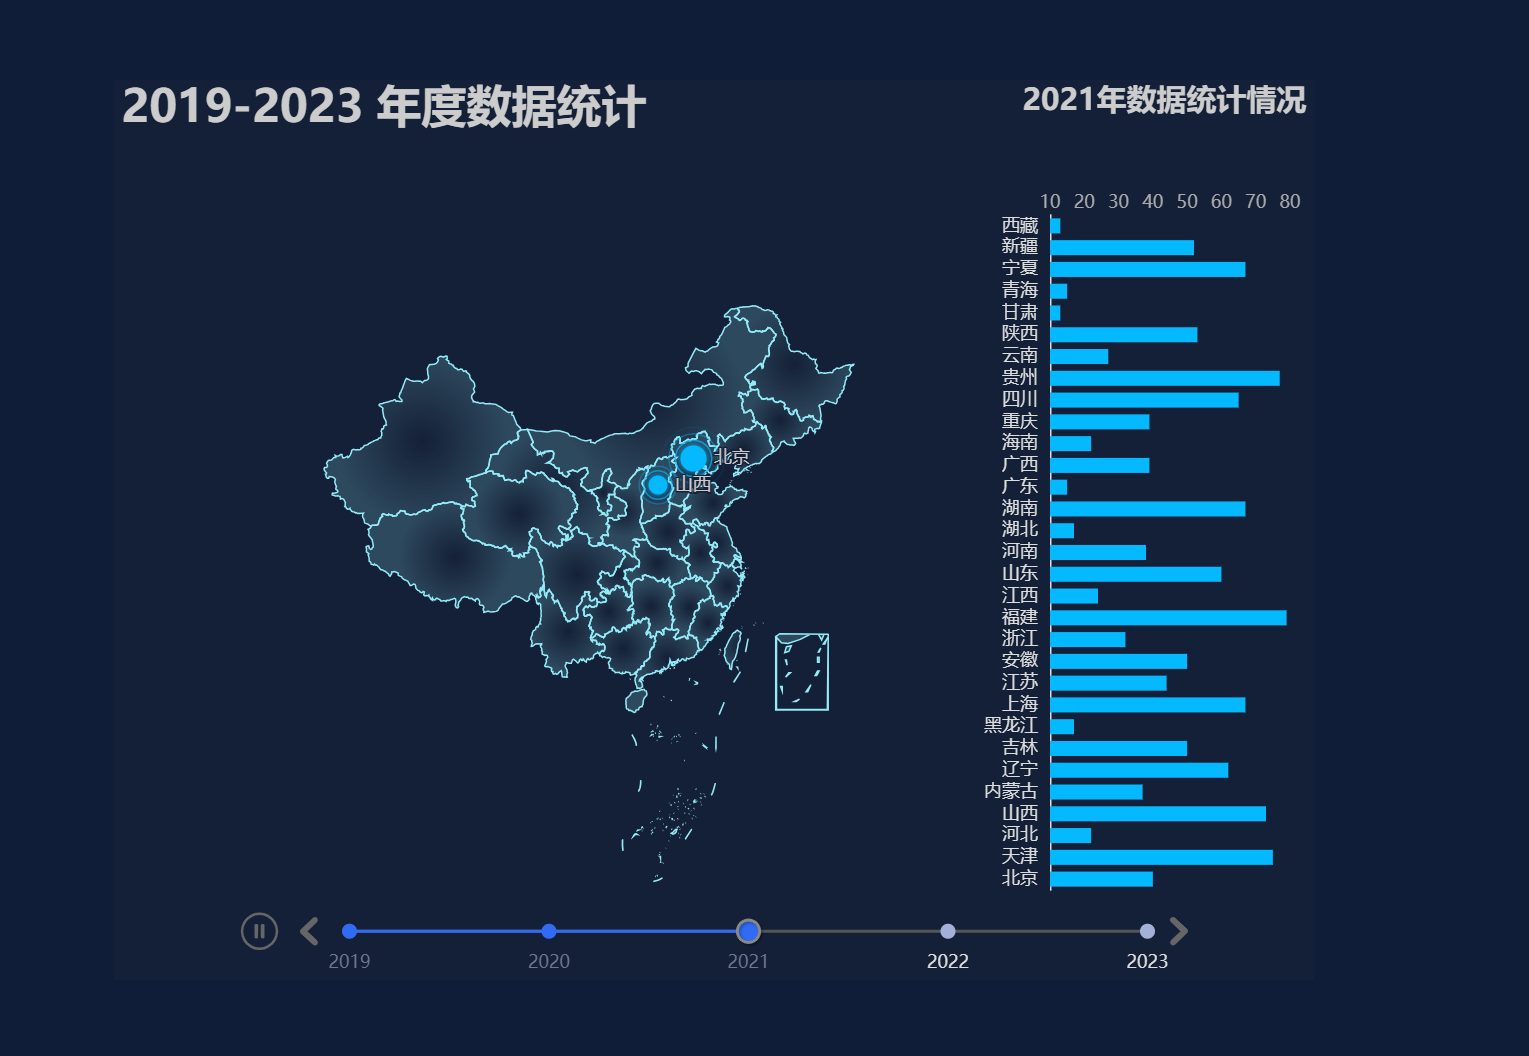
多图叠加

效果图

image-20240515142805132

实现代码

复制可用

下面数组同效果图做了缩减

1
2
3
4
5
6
7
8
9
10
11
12
13
14
15
16
17
18
19
20
21
22
23
24
25
26
27
28
29
30
31
32
33
34
35
36
37
38
39
40
41
42
43
44
45
46
47
48
49
50
51
52
53
54
55
56
57
58
59
60
61
62
63
64
65
66
67
68
69
70
71
72
73
74
75
76
77
78
79
80
81
82
83
84
85
86
87
88
89
90
91
92
93
94
95
96
97
98
99
100
101
102
103
104
105
106
107
108
109
110
111
112
113
114
115
116
117
118
119
120
121
122
123
124
125
126
127
128
129
130
131
132
133
134
135
136
137
138
139
140
141
142
143
144
145
146
147
148
149
150
151
152
153
154
155
156
157
158
159
160
161
162
163
164
165
166
167
168
169
170
171
172
173
174
175
176
177
178
179
180
181
182
183
184
185
186
187
188
189
190
191
192
193
194
195
196
197
198
199
200
201
202
203
204
205
206
207
208
209
210
211
212
213
214
215
216
217
218
219
220
221
222
223
224
225
226
227
228
229
230
231
232
233
234
235
236
237
238
239
240
241
242
243
244
245
246
247
248
249
250
251
252
253
254
255
256
257
258
259
260
261
262
263
264
265
266
267
268
269
270
271
272
273
274
275
276
277
278
279
280
281
282
283
284
285
286
287
288
289
290
291
292
293
294
295
296
297
298
299
300
301
302
303
304
305
306
307
308
309
310
311
312
313
314
315
316
317
318
319
320
321
322
323
324
325
326
327
328
329
330
331
332
333
334
335
336
337
338
339
340
341
342
343
344
345
346
347
348
349
350
351
352
353
354
355
356
357
358
359
360
361
362
363
364
365
366
367
368
369
370
371
372
373
374
375
376
377
378
379
380
381
382
383
384
385
386
387
388
389
390
391
392
393
394
395
396
397
398
399
400
401
402
403
404
405
406
407
408
409
410
411
412
413
414
415
416
417
418
419
420
421
422
423
424
425
426
427
428
429
430
431
432
433
434
435
436
437
438
439
440
441
442
443
444
<!DOCTYPE html>
<html lang="en">
<head>
<meta charset="UTF-8" />
<meta name="viewport" content="width=device-width, initial-scale=1.0" />
<title>Echart合集</title>
<script src="https://cdn.jsdelivr.net/npm/echarts/dist/echarts.min.js"></script>
<style>
* {
margin: 0;
padding: 0;
}
html,
body {
width: 100%;
height: 100%;
}
body {
display: flex;
align-items: center;
justify-content: center;
background-color: #101d38;
}

#myChart {
width: 800px;
height: 600px;
}
</style>
</head>
<body>
<div id="myChart"></div>
<script>
const xhr = new XMLHttpRequest();
xhr.open(
"GET",
"https://geo.datav.aliyun.com/areas_v3/bound/100000_full.json",
true
);
xhr.send();
xhr.onload = function () {
if (xhr.status === 200) {
const data = JSON.parse(xhr.responseText);
render(data);
}
};
// 图表渲染函数
const render = (MapJson) => {
echarts.registerMap("china", MapJson);

const myChart = echarts.init(document.getElementById("myChart"));

const data = {
voltageLevel: ["2019", "2020", "2021", "2022", "2023"],
colors: [
"#1DE9B6",
"#F46E36",
"#04B9FF",
"#5DBD32",
"#FFC809",
"#FB95D5",
"#BDA29A",
"#6E7074",
"#546570",
"#C4CCD3",
],
categoryData: {
2019: [
{
name: "天津",
value: 35,
},
{
name: "河北",
value: 11,
},
],
2020: [
{
name: "上海",
value: 56,
},
{
name: "山西",
value: 33,
},
],
2021: [
{
name: "北京",
value: 123,
},
{
name: "山西",
value: 55,
},
],
2022: [
{
name: "河南",
value: 88,
},
{
name: "湖北",
value: 56,
},
],
2023: [
{
name: "陕西",
value: 88,
},
{
name: "山西",
value: 56,
},
],
},

topData: {
2019: [
{
name: "天津",
value: [117.4219, 39.4189, 84.1],
},
{
name: "河北",
value: [114.4995, 38.1006, 82.4],
},
],
2020: [
{
name: "上海",
value: [121.4648, 31.2891, 51.9],
},
{
name: "山西",
value: [112.3352, 37.9413, 50.7],
},
],
2021: [
{
name: "北京",
value: [116.4551, 40.2539, 69.5],
},

{
name: "山西",
value: [112.3352, 37.9413, 50.4],
},
],
2022: [
{
name: "河南",
value: [113.4668, 34.6234, 61],
},

{
name: "湖北",
value: [114.3896, 30.6628, 48.5],
},
],
2023: [
{
name: "陕西",
value: [109.1162, 34.2004, 44.2],
},
{
name: "山西",
value: [112.3352, 37.9413, 43.9],
},
],
},
};

let options = {
// 时间线,提供了在多个 ECharts option 间进行切换
timeline: {
// 数据
data: data.voltageLevel,
// 类目轴
axisType: "category",
// 自动切换
autoPlay: true,
// 间隔时间
playInterval: 3000,
// 位置
left: "10%",
right: "10%",
bottom: "0%",
width: "80%",
// 轴的文本标签
label: {
// 默认状态
normal: {
textStyle: {
color: "#ddd",
},
},
// 高亮状态
emphasis: {
textStyle: {
color: "#fff",
},
},
},
// 文字大小
symbolSize: 10,
// 线的样式
lineStyle: {
color: "#555",
},
// 选中点的样式
checkpointStyle: {
borderColor: "#888",
borderWidth: 2,
},
// 控件样式
controlStyle: {
// 上一步按钮
showNextBtn: true,
// 下一步按钮
showPrevBtn: true,
// 默认样式
normal: {
color: "#666",
borderColor: "#666",
},
// 高亮样式
emphasis: {
color: "#aaa",
borderColor: "#aaa",
},
},
},

baseOption: {
// 统计图位置
grid: {
right: "2%",
top: "15%",
bottom: "10%",
width: "20%",
},
// 中国地图
geo: {
// 展示
show: true,
// 中国地图
map: "china",
// 开启缩放
roam: true,
// 初始缩放
zoom: 0.8,
// 地图中心点(可用来控制地图在图表容器的位置)
center: [118.83531246, 34.0267395887],
// 默认状态的省份样式
itemStyle: {
normal: {
// 边框色值
borderColor: "rgba(147, 235, 248, 1)",
// 边框宽度
borderWidth: 1,
// 区域颜色
areaColor: {
// 经向色值
type: "radial",
x: 0.5,
y: 0.5,
r: 0.5,
colorStops: [
// 0% 处的颜色
{
offset: 0,
color: "rgba(147, 235, 248, 0)",
},
// 100% 处的颜色
{
offset: 1,
color: "rgba(147, 235, 248, .2)",
},
],
// 缺省为 false
globalCoord: false,
},
},
// 鼠标移入的色值
emphasis: {
areaColor: "#389BB7",
borderWidth: 0,
},
},
},
},
// 绑定时间轴的多个图表
options: [],
};

// 为每一年度的图表添加数据
data.voltageLevel.forEach((item, index) => {
options.options.push({
// 背景色
backgroundColor: "#142037",
title: [
// 主标题
{
text: "2019-2023 年度数据统计",
left: "0%",
top: "0",
textStyle: {
color: "#ccc",
fontSize: 30,
},
},
// 副标题
{
id: "statistic",
text: item + "年数据统计情况",
right: "0%",
top: "0%",
textStyle: {
color: "#ccc",
fontSize: 20,
},
},
],
// X 轴配置
xAxis: {
// 数据轴
type: "value",
// 脱离 0 值比例
scale: true,
// 位置
position: "top",
// 不显示分割线
splitLine: {
show: false,
},
// 不显示轴线
axisLine: {
show: false,
},
// 不显示刻度尺
axisTick: {
show: false,
},
// 类别文字
axisLabel: {
margin: 2,
textStyle: {
color: "#aaa",
},
},
},
// Y 轴
yAxis: {
// 选项轴
type: "category",
// 轴线
axisLine: {
show: true,
lineStyle: {
color: "#ddd",
},
},
// 轴刻度
axisTick: {
show: false,
lineStyle: {
color: "#ddd",
},
},
// 轴标签
axisLabel: {
interval: 0,
textStyle: {
color: "#ddd",
},
},
// 根据年份,获取对应数据
data: data.categoryData[item].map((item) => item.name),
},
// 核心配置
series: [
// 柱形图
{
zlevel: 1.5,
// 柱形图
type: "bar",
// 每个柱子的色值
itemStyle: {
normal: {
color: data.colors[index],
},
},
// 根据年份,获取对应数据
data: data.categoryData[item].map((item) => item.value),
},
// 散点图
{
// 散点(气泡)图
type: "effectScatter",
// 使用地理坐标系
coordinateSystem: "geo",
// 数据
data: data.topData[item],
// 标记大小
symbolSize: function (val) {
return val[2] / 4;
},
// 绘制完成后显示特效
showEffectOn: "render",
// 展示涟漪特效
rippleEffect: {
brushType: "stroke",
},
// 文字
label: {
normal: {
formatter: "{b}",
position: "right",
show: true,
},
},
// 每一项的配置
itemStyle: {
normal: {
color: data.colors[index],
// 阴影配置
shadowBlur: 5,
shadowColor: data.colors[index],
},
},
zlevel: 1,
},
],
});
});

myChart.setOption(options);
};
</script>
</body>
</html>